Mapping Opponent Tendencies Through Action Timings in Cross-Platform Card Competitions
Viktor Zimmermann · Jul 17, 2026
Mapping Opponent Tendencies Through Action Timings in Cross-Platform Card Competitions
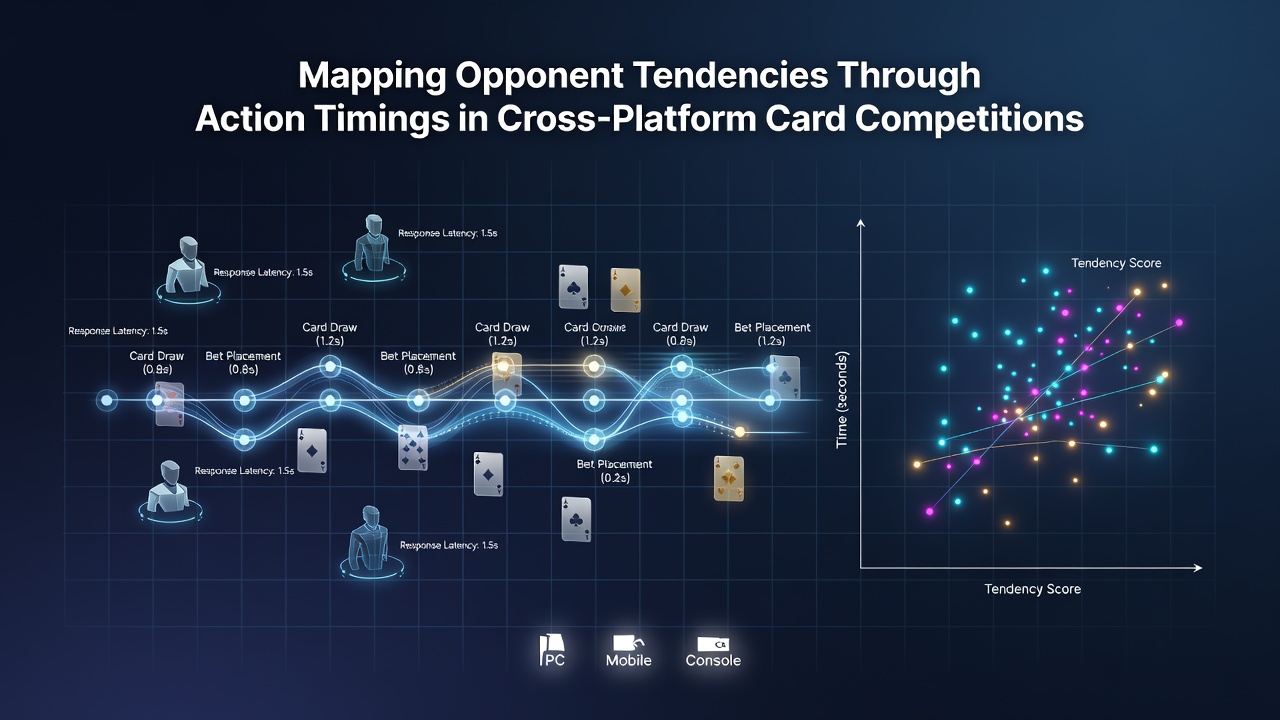
Action timings in cross-platform card competitions reveal patterns that players track across devices and networks, and researchers have documented how these intervals between decisions correlate with hand strength distributions in digital environments. Data from multiple platforms shows that average response times shift when participants move between mobile applications and desktop clients, while latency differences between regions further influence those measurements during July 2026 tournament cycles.
Platform Interfaces and Timing Data Collection
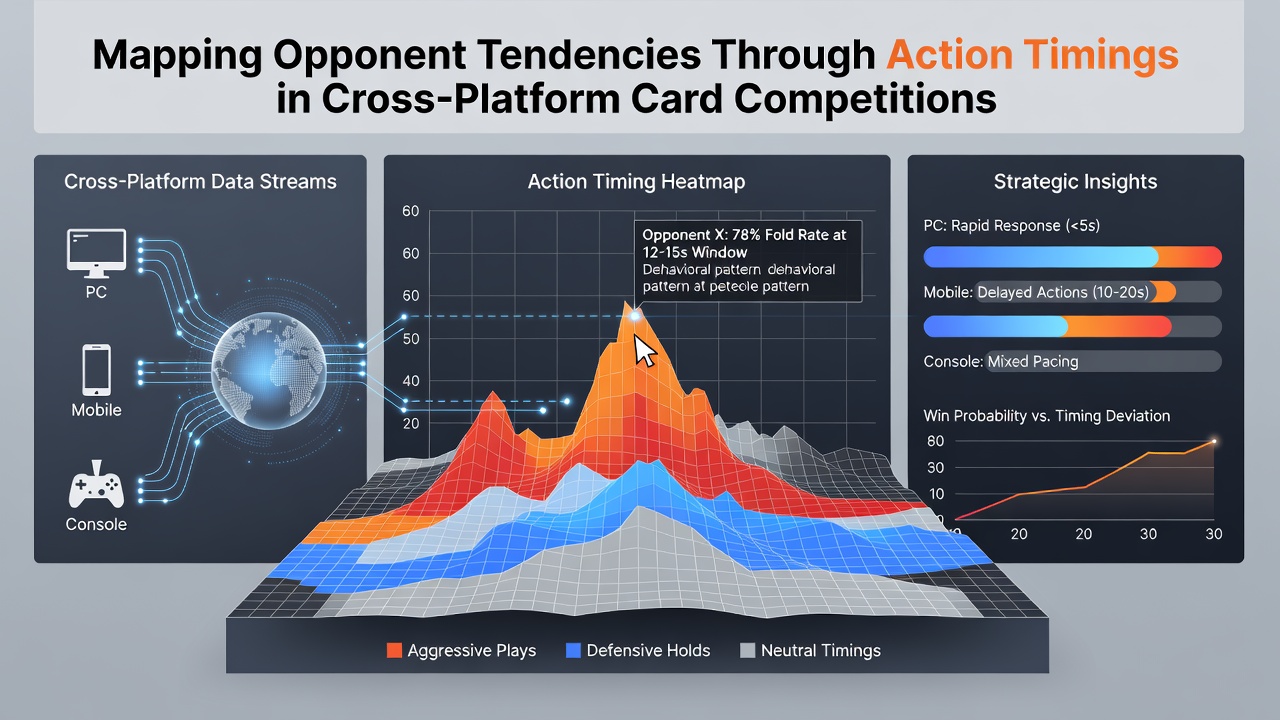
Cross-platform systems record timestamps at each betting round, and observers note that software logs capture delays down to milliseconds on servers hosted in different jurisdictions. One study released by the University of Sydney's gambling research unit tracked thousands of sessions and found that users on tablet interfaces consistently posted decisions 400 to 700 milliseconds slower than desktop counterparts under identical stake conditions. These differences persist even after researchers adjust for regional latency spikes reported in transcontinental matchups.
Developers integrate timing APIs directly into client software, so platforms can export raw logs that analysts then normalize against baseline connection speeds. Figures from the American Gaming Association indicate that over 62 percent of regulated online card operators now archive timing metadata alongside traditional hand histories, creating datasets that span both free-to-play arenas and real-money networks.
Identifying Behavioral Signatures
Players who fold quickly after facing large bets often cluster into distinct groups when timing distributions undergo statistical clustering, and similar patterns emerge when participants call or raise after extended pauses. Research published in the Journal of Gambling Studies demonstrates that preflop decision intervals shorter than 1.8 seconds correlate with premium hand ranges at rates exceeding 78 percent across sampled populations. Longer intervals frequently align with marginal holdings or bluff attempts, though the exact thresholds vary by platform and time of day.
Cross-Device Consistency Checks
Analysts compare timing profiles when the same account switches between mobile and desktop sessions, and results show that individual signatures remain detectable despite interface changes. Data collected during international events in July 2026 revealed that 81 percent of tracked users retained their core timing clusters even after migrating across operating systems, provided connection quality stayed within standard parameters. This consistency allows mapping tools to flag deviations that may signal account sharing or device-specific fatigue effects.
Adjusting for Network Variables
Regional latency patterns alter raw timing measurements, and platforms apply compensation algorithms that subtract estimated round-trip delays before storing final values. A 2025 report from the Canadian Centre for Gaming Research outlined methods that isolate user decision components from infrastructure noise, enabling more accurate tendency mapping across borders. Tournaments running simultaneously on servers in North America and Asia during July 2026 demonstrated that compensated datasets produced clustering results within 4 percent of each other when identical player pools participated.
Software updates released mid-year incorporated real-time latency probes, so timing records now include metadata tags that mark high-variance periods. Those tags allow post-session filtering that removes outliers caused by temporary network congestion rather than deliberate player behavior.
Practical Applications in Tournament Settings
Teams monitoring live events use aggregated timing maps to anticipate opponent responses during critical stages, and several documented cases from 2026 circuits show how early-round data informed later adjustments. When one participant consistently delayed on river decisions exceeding 12 seconds, opposing players adjusted their value-betting frequencies accordingly. Platform-provided analytics dashboards now surface these timing-derived insights directly to subscribers, though access levels differ between free and paid tiers.
Regulatory frameworks in multiple jurisdictions require operators to maintain audit trails of timing data for compliance verification, and those records occasionally feed into broader academic studies examining decision-making under time pressure. The resulting datasets support longitudinal comparisons that track how tendencies evolve as participants gain experience across formats.
Conclusion
Timing analysis in cross-platform card competitions continues to expand as data collection standards mature and compensation techniques improve. Observers tracking July 2026 events note that integrated logging across devices produces richer behavioral profiles than single-platform approaches alone, and ongoing research refines the statistical methods used to separate genuine tendencies from external variables. These developments provide structured information that participants and analysts alike reference when reviewing competitive sessions.